The best time to buy a home is the first week of October
The best week offers a balanced mix of market conditions that favor buyers
Highlights
- The 2021 homebuying season has aligned with pre-pandemic seasonal patterns, with a familiar sweet spot for buyers expected in the fall.
- Nationally, the best time to buy a home is the week of October 3-9.
- If historical trends hold, the best week could add 100,000 homes to the inventory over the 2021 peak so far. Buyers could save $10,000 during this week compared to the summer peak for a median priced home of $385,000
- There is local variation from market to market. In the largest metro areas, such as Los Angeles, Boston, New York City, Denver, Portland, and Minneapolis, the best week comes earlier, during the week of September 12-18.
Since the start of the pandemic, buying a home has been a challenge for many shoppers. Surging home prices, a blistering market pace, and intense competition from other buyers have made the process of finding and buying a dream home into a frustrating endeavor for many, including first time home buyers looking to make the leap from renting to owning.
Fortunately for buyers, some relief may be on the horizon as the season quickly approaches the best time to buy — the time of year when the balance of market conditions favor buyers the most. According to our analysis of realtor.com listing data since 2018, the best time to buy a home this year will be the week of October 3-9.
With all of the challenges facing buyers as the housing market recovers from the impact of the pandemic, this week provides a balance of market conditions that favor buying over every other week of the year.
Is the housing market back to normal?
After a rough start, the 2021 homebuying season is starting to look more and more like a pre-pandemic year. That’s good news for buyers looking forward to things slowing down, albeit slightly, after the summer.
The home buying season in 2020 was anything but typical. The pandemic completely disrupted the real estate market, initially causing a near shut down of the industry nationwide, and eventually delaying a lot of usual trends, extending the season into the fall and winter, long past the time of year when buyers are usually active.
In 2021, the housing market started where 2020 left off — inventory shortages, intense demand, and surging prices. For a portion of 2021, housing market conditions trended away from a buyer-friendly direction. However, despite starting like 2020, the rest of the year is looking much more like a pre-pandemic seasonal pattern.
Even though the market is challenging, prices peaked in the summer, listings are on the rise, and the pace of the market is becoming more manageable — all things we would see in a typical homebuying season.
This is important for buyers because a typical seasonal trend means that the homebuying sweet spots later in the year should show up around the same time as pre-pandemic seasons.
The year so far
In addition to record-high listing prices, buyers have been faced with a housing market that moves at a very fast pace. As of August, the national median time on market for a home was 39 days, down from 56 days last year. Whereas buyers had nearly two months to lock down a home before it sold last year, they now have just over one month. And in the hottest zip codes, the typical home sells within a few days of going on the market.
Extreme inventory shortages at the start of the year led buyers to scramble during their home search. At its lowest point, housing inventory was down 53% compared to last year. Fortunately for buyers, more sellers continue to enter the market, spurred by record-high prices. Inventory woes have eased somewhat, with inventory down just 26% in August and trending in the right direction. Moreover, new listings continue to enter the market, with the summer consistently bringing over 100,000 new listings to the market for 15 of the last 17 weeks.
One major factor keeping buying within reach is the mortgage rate trend, with rates remaining at historical lows (2.87% in August) even as prices rise. Lower rates translate to lower monthly costs, which helps to offset the rising home prices.
Why the first week of October?
Nationally, the best time to buy in 2021 is the week of October 3-9. This week historically has shown the best balance of market conditions that favor buyers. Inventory tends to be high, prices are below peak levels, demand is waning, and pace of the market slows to a more manageable speed.
This seasonal slowdown is partly driven by the school schedule. Typical housing market activity begins in earnest in spring and peaks in summer. Then as the year transitions to fall and more families bow out due to the school schedule, demand wanes, and prices dip to post-peak levels as leftover inventory stays on the market.
This is the sweet spot for buyers who can capitalize on that confluence of factors to have a wider variety of options at a more reasonable price.
Plentiful Listings
During the best week, buyers can expect listings to rise beyond what they’ve been seeing so far this year. Historically, the fall is the time of year when inventory peaks. This is a welcome shift in the season, as inventory has been a constant struggle for eager buyers searching for their dream home. The typical seasonal trend expects this week to have 17.6% more active listings than the start of the year.
If this trend holds in 2021, we can expect to see around 705,000 listings on the market in October, which is roughly 100,000 more active listings nationwide than during the peak summer season in July and 166,000 (31%) more active listings than the average week so far this year.
Less Competition From Other Buyers
Home buyers shopping during the best week should expect less competition from other buyers. July is typically the peak for homebuyer demand, as measured by views per property on realtor.com. The summer has the highest concentration of buyers looking at each home for sale, which translates to competition for buyers looking to lock down a home. During the Best Week, demand is 18% lower than the peak in July, and 6% lower than the average week.
A More Manageable Market Pace
Another challenging aspect of homebuying, especially in 2021, is the pace of the market, or how long it takes homes to sell. This year has seen homes selling at a quickening pace, with some of the hottest zip codes having an average time of sale of just a few days. This means buyers have to potentially buy a home sight unseen or make more concessions to close a deal before more competition can chime in.
The best week should offer some relief to those who need a bit more time to make their decision. The best week historically slowed by 18% compared to the peak pace earlier in the year. With a median time on market of 37 days in June, by the time the best week comes around in October, that pace should slow down to 44 days, adding an additional week for buyers.
Lower Post-Peak Home Prices
Prices and affordability remain at the forefront of many buyers’ minds, especially with the streak of double-digit price growth seen earlier in the year. At a national level, prices could dip 2.6% compared to the typical season high. With a peak median listing price of $385,000 this year, buyers shopping during the best week could save $10,000. And in several of the largest housing markets around the country, home prices during the best week can dip over 10% lower than their peak price earlier in the year, potentially saving them tens of thousands of dollars.
More Fresh Listings
In addition to active inventory on the market, the addition of fresh listings entering the market gives buyers more options. The best week historically has added 6% more listings than the average week and 19% more than the start of the year.
According to the most recent realtor.com data, 2021 has already surpassed this expectation. Due to the pandemic, new listing counts started low as sellers trickled into the market. But as the year has progressed and sellers have gradually returned to the market in growing numbers, the number of fresh listings coming on the market has gradually increased, with the summer consistently bringing over 100,000 new listings to the market for 15 of the last 17 weeks.
This is signaling a continued rise of new listings through the latter half of the year, further sweetening the sweet spot of the best week for buyers.
More Price Reductions
The best week also represents one of the peak weeks for price reductions throughout the year, with an average of 7.0% of homes seeing price reductions that week. Nationally, this could mean roughly 50,000 homes seeing price reductions this year, based on inventory estimates.
This peak is driven by a combination of buyers leaving the market, which brings down demand, in addition to a build up of inventory throughout the year. While new homes continue to enter the market, they add to the already-increasing back-stock of homes that haven’t yet sold at that point in the year. This means more competition among sellers for the dwindling number of buyers, which leads to price reductions for sellers hoping to sell before bowing out and waiting until next year. Importantly, many sellers are buyers themselves, and are motivated by many of the similar seasonal milestones like the school calendar.
Finding the best time to buy
Price and availability (i.e. inventory) tend to be highlights of things a buyer will keep in mind during their home search–are there homes they want and can afford?
But there are a few other metrics buyers may not be aware of that we at realtor.com have insight into. Things like competition from other buyers, the pace of the market, and the number of price reductions in the area–all factors that play a part in locking down the right home at the right time.
To determine the best time to buy, we examined the historical data since 2018 for multiple housing market metrics. These include: 1) listing prices, 2) inventory levels, 3) new “fresh” listings, 4) time on market, 5) homebuyer demand (realtor.com listing views), and 6) price reductions.
We scored each week of the year from 0-100 based on the number of active listings. A given week scored highly if it had more listings compared to other weeks of the year. We scored the other metrics in the same way, so each week had six different scores, one for each metric.
We then ranked each week by the average of those scores. The week with the highest overall score was designated as the best time to buy. This week represents a balanced view of market conditions favorable for buyers.
Local market sweet spots
Although nationally the best time to buy is the week of October 3-9, some of the largest housing markets in the country have their local best time just around the corner. The week of September 12-18 is the best time to buy for Boston, Denver, Detroit, Los Angeles, Minneapolis, New York City, and Portland metropolitan areas.
Housing Markets Where the Best Time to Buy is Sept 12-18
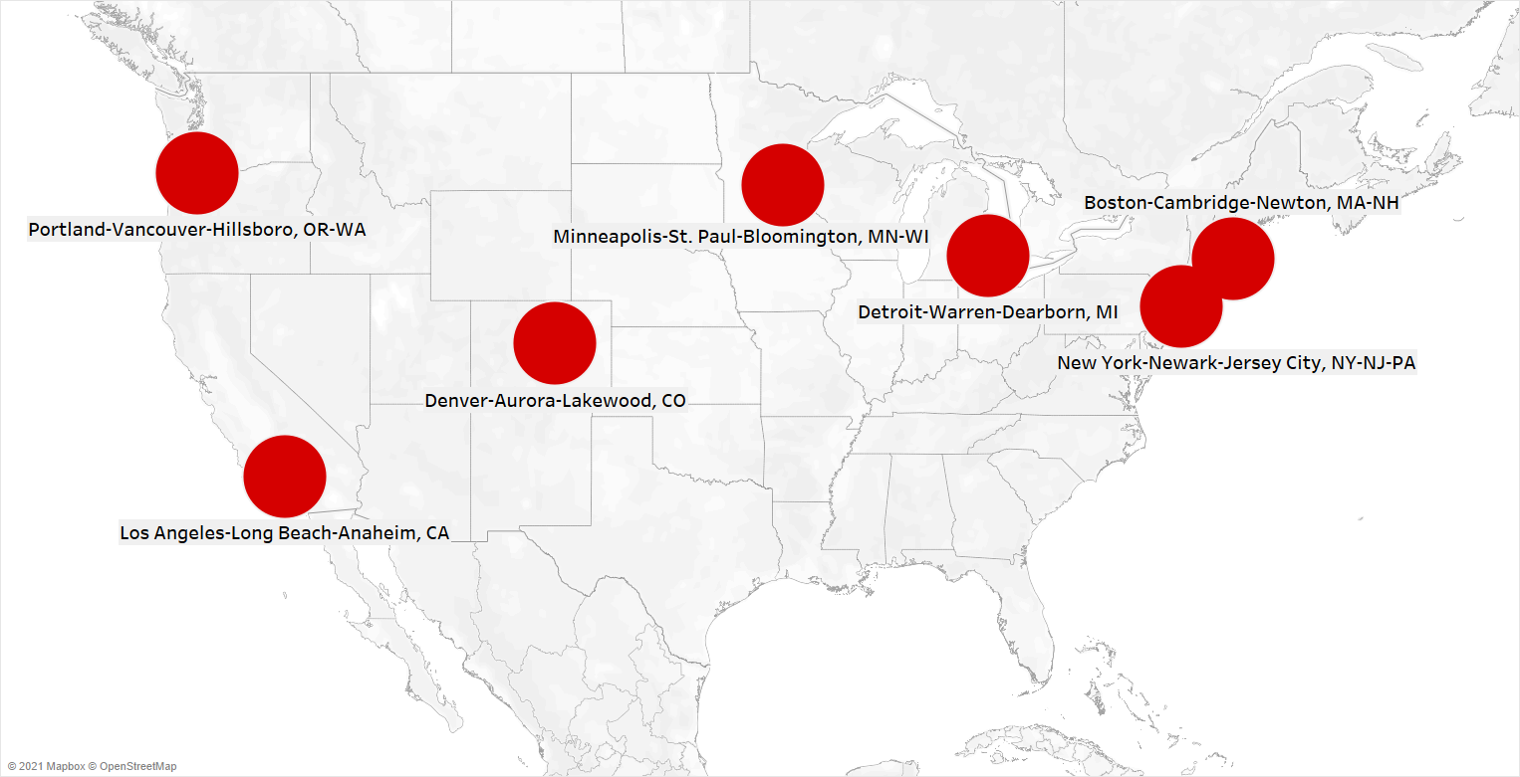
Those markets made up 17.4% of the national inventory in July. Among those markets, the week of September 12-18 has historically had an average of 27% more listings on the market over the typical week of the year. Competition with other buyers, as measured by views per property, has been down 32% during this time compared to the average week. The time on market has been up 40%. On average, listing prices are 5.8% lower during this week compared to the peak prices in these areas at other times of the year. New listings in these areas are typically up 26% compared to the average week.
Each of these housing markets strike a different balance of market factors during this week is it relates to buyers.
In Detroit, the week of September 12-18 typically has 69% more active listings than the average week in the year. In tandem with higher inventory is lower demand, with views per property down 51% during this week compared to the peak earlier in the year. That means half the competition from other homebuyers compared to the typical week. The added inventory spreads buyers out and eases the intense competition per home.
In New York and Boston, homes on the market during this time take 40% longer to sell, on average, compared to their respective seasonal peaks when homes sell fastest. Buyers who feel intimidated or frustrated by the lightning-fast pace of sales earlier this year may find the market more approachable as autumn approaches. In particular, Boston typically sees the time on market rise 63% compared to its lowest point when homes are selling fastest in the spring. With Boston homes selling in 21 days at their fastest this year, the best week would add 13 days –nearly 2 weeks–of breathing room for buyers.
Across these markets, listing prices have been 5.8% below their seasonal peaks, on average, during their respective best weeks. Minneapolis has historically seen the biggest drops, at 11.2% below peak prices. With the peak price in Minneapolis reaching $382,000 in March, that would translate to a savings of $42,800 during the best week.
Housing Markets Where the Best Time to Buy is September 12-18
| Metro | Active Listings vs Avg | Views Per Property vs Peak | Days on Market vs Peak | Median Listing Price vs Peak | New Listings vs Avg | Price Reductions vs Avg |
| Boston-Cambridge-Newton, MA-NH | 21% | -30% | 63% | -5.8% | 45% | 2.4% |
| Denver-Aurora-Lakewood, CO | 23% | -39% | 50% | -8.6% | 22% | 3.1% |
| Detroit-Warren-Dearborn, MI | 69% | -51% | 27% | -7.0% | 18% | 0.0% |
| Los Angeles-Long Beach-Anaheim, CA | 17% | -27% | 36% | -0.9% | 18% | 1.3% |
| Minneapolis-St. Paul-Bloomington, MN-WI | 25% | -28% | 20% | -11.2% | 34% | 3.1% |
| New York-Newark-Jersey City, NY-NJ-PA | 8% | -18% | 39% | -3.9% | 25% | 1.0% |
| Portland-Vancouver-Hillsboro, OR-WA | 24% | -30% | 47% | -3.5% | 19% | 2.1% |
Best Time to Buy – Top 50 Largest Metro Areas
| Metro | Best Week | Active Listings vs Avg | Views Per Property vs Peak | Days on Market vs Peak | Median Listing Price vs Peak | New Listings vs Avg | Price Reductions vs Avg |
| United States | Oct 3 – Oct 9 | 7% | -18% | 18% | -2.6% | 6% | 1.3% |
| Atlanta-Sandy Springs-Roswell, GA | Oct 3 – Oct 9 | 11% | -23% | 25% | -6.6% | 12% | 1.4% |
| Austin-Round Rock, TX | Sep 19 – Sep 25 | 13% | -22% | 34% | -4.8% | 3% | 1.6% |
| Baltimore-Columbia-Towson, MD | Oct 17 – Oct 23 | 10% | -25% | 31% | -5.3% | 3% | 1.4% |
| Birmingham-Hoover, AL | Oct 3 – Oct 9 | 4% | -14% | 19% | -5.1% | 4% | 0.7% |
| Boston-Cambridge-Newton, MA-NH | Sep 12 – Sep 18 | 21% | -30% | 63% | -5.8% | 45% | 2.4% |
| Buffalo-Cheektowaga-Niagara Falls, NY | Nov 14 – Nov 20 | 9% | -45% | 90% | -11.6% | -14% | 1.9% |
| Charlotte-Concord-Gastonia, NC-SC | Oct 3 – Oct 9 | 7% | -16% | 22% | -5.6% | 6% | 1.6% |
| Chicago-Naperville-Elgin, IL-IN-WI | Sep 19 – Sep 25 | 16% | -30% | 26% | -6.1% | 12% | 1.6% |
| Cincinnati, OH-KY-IN | Oct 10 – Oct 16 | 12% | -24% | 23% | -9.3% | 9% | 1.3% |
| Cleveland-Elyria, OH | Oct 17 – Oct 23 | 12% | -21% | 23% | -7.7% | 3% | 1.7% |
| Columbus, OH | Oct 3 – Oct 9 | 21% | -34% | 40% | -12.3% | 10% | 3.3% |
| Dallas-Fort Worth-Arlington, TX | Oct 3 – Oct 9 | 12% | -25% | 37% | -8.5% | 5% | 1.9% |
| Denver-Aurora-Lakewood, CO | Sep 12 – Sep 18 | 23% | -39% | 50% | -8.6% | 22% | 3.1% |
| Detroit-Warren-Dearborn, MI | Sep 12 – Sep 18 | 69% | -51% | 27% | -7.0% | 18% | 0.0% |
| Hartford-West Hartford-East Hartford, CT | Oct 3 – Oct 9 | 9% | -21% | 46% | -2.8% | 10% | 1.7% |
| Houston-The Woodlands-Sugar Land, TX | Oct 3 – Oct 9 | 5% | -25% | 35% | -4.6% | -1% | 1.7% |
| Indianapolis-Carmel-Anderson, IN | Oct 3 – Oct 9 | 17% | -27% | 30% | -15.6% | 19% | 2.2% |
| Jacksonville, FL | Sep 26 – Oct 2 | 3% | -24% | 17% | -6.3% | 5% | 1.5% |
| Kansas City, MO-KS | Oct 3 – Oct 9 | 13% | -27% | 32% | -7.3% | 11% | 1.8% |
| Las Vegas-Henderson-Paradise, NV | Oct 24 – Oct 30 | 13% | -34% | 20% | -6.6% | 6% | 2.7% |
| Los Angeles-Long Beach-Anaheim, CA | Sep 12 – Sep 18 | 17% | -27% | 36% | -0.9% | 18% | 1.3% |
| Louisville/Jefferson County, KY-IN | Nov 7 – Nov 13 | 12% | -20% | 24% | -11.3% | -3% | 1.5% |
| Memphis, TN-MS-AR | Sep 19 – Sep 25 | 7% | -18% | 17% | -1.1% | 20% | 1.4% |
| Miami-Fort Lauderdale-West Palm Beach, FL | Feb 7 – Feb 13 | 6% | -12% | 11% | -2.5% | 25% | 0.5% |
| Milwaukee-Waukesha-West Allis, WI | Oct 3 – Oct 9 | 17% | -22% | 31% | -16.1% | -4% | 2.5% |
| Minneapolis-St. Paul-Bloomington, MN-WI | Sep 12 – Sep 18 | 25% | -28% | 20% | -11.2% | 34% | 3.1% |
| Nashville-Davidson–Murfreesboro–Franklin, TN | Oct 31 – Nov 6 | 10% | -16% | 30% | -4.6% | 12% | 1.4% |
| New Orleans-Metairie, LA | Oct 3 – Oct 9 | 1% | -13% | 22% | -5.6% | 4% | 0.8% |
| New York-Newark-Jersey City, NY-NJ-PA | Sep 12 – Sep 18 | 8% | -18% | 39% | -3.9% | 25% | 1.0% |
| Oklahoma City, OK | Oct 3 – Oct 9 | 1% | -18% | 26% | -2.7% | 15% | 1.4% |
| Orlando-Kissimmee-Sanford, FL | Oct 31 – Nov 6 | 4% | -20% | 11% | -4.0% | -1% | 1.1% |
| Philadelphia-Camden-Wilmington, PA-NJ-DE-MD | Jun 6 – Jun 12 | 6% | -28% | 6% | -1.1% | 30% | 1.4% |
| Phoenix-Mesa-Scottsdale, AZ | Jan 10 – Jan 16 | 10% | -18% | 48% | -7.8% | 19% | 0.1% |
| Pittsburgh, PA | Jan 10 – Jan 16 | 3% | -22% | 83% | -12.8% | -12% | -1.5% |
| Portland-Vancouver-Hillsboro, OR-WA | Sep 12 – Sep 18 | 24% | -30% | 47% | -3.5% | 19% | 2.1% |
| Providence-Warwick, RI-MA | Oct 3 – Oct 9 | 16% | -18% | 26% | -4.1% | 20% | 1.9% |
| Raleigh, NC | Oct 17 – Oct 23 | 10% | -20% | 31% | -4.1% | 5% | 2.5% |
| Richmond, VA | Oct 3 – Oct 9 | 11% | -17% | 26% | -5.6% | 13% | 1.9% |
| Riverside-San Bernardino-Ontario, CA | Oct 3 – Oct 9 | 5% | -20% | 12% | -1.5% | 12% | 1.1% |
| Rochester, NY | Sep 26 – Oct 2 | 15% | -29% | 43% | -10.7% | -2% | 1.9% |
| Sacramento–Roseville–Arden-Arcade, CA | Oct 3 – Oct 9 | 20% | -33% | 49% | -4.6% | 1% | 1.5% |
| St. Louis, MO-IL | Sep 26 – Oct 2 | 11% | -17% | 18% | -4.3% | 12% | 1.5% |
| San Antonio-New Braunfels, TX | Sep 19 – Sep 25 | 11% | -23% | 25% | -5.6% | 23% | 1.2% |
| San Diego-Carlsbad, CA | Oct 31 – Nov 6 | 8% | -40% | 45% | -6.5% | -6% | 1.4% |
| San Francisco-Oakland-Hayward, CA | Oct 17 – Oct 23 | 31% | -44% | 58% | -5.9% | 7% | 2.3% |
| San Jose-Sunnyvale-Santa Clara, CA | Oct 3 – Oct 9 | 29% | -50% | 75% | -10.3% | 8% | 3.1% |
| Seattle-Tacoma-Bellevue, WA | Sep 26 – Oct 2 | 41% | -53% | 93% | -7.3% | 16% | 2.9% |
| Tampa-St. Petersburg-Clearwater, FL | Jan 10 – Jan 16 | 2% | -15% | 27% | -7.1% | 12% | 0.3% |
| Virginia Beach-Norfolk-Newport News, VA-NC | Nov 7 – Nov 13 | 3% | -30% | 38% | -4.8% | -1% | 0.1% |
| Washington-Arlington-Alexandria, DC-VA-MD-WV | Sep 19 – Sep 25 | 14% | -26% | 49% | -4.8% | 11% | 1.3% |
Methodology
Realtor.com analyzed six supply and demand metrics at a national and metropolitan level using data for 2018-2019 period (2020 data was omitted due to anomalies caused by the pandemic). Those metrics include: 1) listing prices, 2) inventory levels, 3) new “fresh” listings, 4) time on market, 5) homebuyer demand (realtor.com views per property), and 6) price reductions.
Each week of the year was scored from 0 to 100 based on the number of active listings. A given week scored highly if it had more listings compared to other weeks of the year. The other metrics were scored in the same way, such that each week had six different scores for active listings, new listings, listing prices, days on market, price reductions, and views per property. (In the case of prices, lower prices score higher. Same with views per property).
Each week was then ranked by the average of those scores. The week with the highest composite score was considered the best time to buy. This week represents a balanced view of market conditions favorable for buyers.